Arm outline atomics
Arm outline atomics
One of the features introduced in the Armv8.1-A architecture version were new atomic instructions, also known as LSE (large system extensions). They include a number of atomic operations done with a single atomic instruction (CAS – compare and swap, arithmetic operations etc.) which result in a significant performance improvement over “normal” implementation, which usually has exclusive load, operation, exclusive store, check if the operation was not interrupted and a branch if it was interrupted (also known as LL/SC). The performance improvement could be estimated as roughly 20%, and could benefit lockless algorithms and containers in Unity, as well as the job system (especially with tiny jobs) and other subsystems.
An obvious question which follows is device support. Currently, when targeting Arm64 in Unity, we default to the vanilla Armv8-A architecture version, which is fully supported by every 64-bit Arm device in the world. Support for Armv8.1-A extensions was mandated in Cortex A75, which is equivalent to Samsung Galaxy S9 (released 2018). This means that a significant share of our end-users are still on a device which doesn’t support LSE. If such a device stumbles upon an LSE instruction, the process will immediately die with an “invalid operation” exception (ILLOPC). So we cannot just go and enable LSE all over the place (which can be done by passing -march=armv8-a+lse to the compiler).
A potential solution would be to have both options (LSE and LL/SC) with a runtime dispatch. Luckily, Arm has done a fantastic job which takes care of everything in the compiler itself, and it’s called outline atomics (option present in GCC and clang): https://reviews.llvm.org/D91157 and https://github.com/llvm/llvm-project/blob/main/llvm/docs/Atomics.rst. The idea is as follows:
- You add
-moutline-atomicsflag to your compiler command line - The compiler generates code which does runtime detection of your CPU capabilities (does it support LSE or not?)
- The compiler generates intrinsic functions (for different kinds of atomic operations) which have two branches: LSE and LL/SC, which one is called depends on the CPU capabilities (see previous item)
- Every time your code does an atomic operation, the compiler inserts a call to the corresponding intrinsic function. This means that on old devices, the path with LL/SC will be selected, while LSE-capable devices will be running LSE code – all that with zero changes needed to your code, nice and backward compatible! You only have to add the compiler flag.
Magic!
But in the end, is it free performance? For every atomic instruction, you have to pay the cost of calling a function and doing an if on CPU capabilities (likely an easy target to the branch predictor). Compare this to inlined atomic instructions – be it LL/SC or pure LSE (if you’re targeting only modern CPUs). Our friends at Arm (including the developer of the outline atomics feature in LLVM) say that the benefit of LSE is much higher than the cost associated with the function call, so it’s a net plus. If so, it sounds like we could provide some performance improvement for our users at a very low cost! Let’s give it a try.
Before we start, I must share a well-known study of LSE in MySQL which TL;DR resulted in “no benefit”. Interesting, and let’s keep it in mind.
Implementation
It’s a one-liner, a usual case for complicated but well-designed features: just add -moutline-atomics to the clang flags.
Performance assessment strategy
This is the most important thing. Here’s the plan:
- A non-LSE-capable device (an older device)
- Baseline: no outline atomics, basically inlined LL/SC code, as it exists currently in our codebase.
- Outline atomics: enable outline atomics. In this case, no improvement is expected, just the overhead of having to call the outlined functions. A perfect result would be no regression or a regression around measurement error (up to 5%). If the regression is significant (20+%), then it’s a red flag.
- An LSE-capable-device (a newer device)
- Baseline: no outline atomics, basically inlined LL/SC code, as it exists currently in our codebase.
- Outline atomics: enable outline atomics. In this case, an improvement is expected because of the new LSE instructions, minus the function call overhead. A perfect result would be an improvement of 10+%. No improvement is a red flag.
- Pure LSE: enable LSE as the target in the compiler command line. This option is there to compare with outline atomics and try to assess the function call and CPU capabilities branch overhead. Not shippable because not compatible with older devices, but helps understand the nature of improvement/regression with outline atomics. Must perform better than previous option.
The following devices were used:
- non-LSE: nVidia Shields in our CI buildfarm, Cortex A57
- non-LSE: Huawei Honor 9, Cortex A53 (tested locally)
- LSE: Samsung Galaxy S22, Cortex X2+A710+A510, latest Armv9 device on the market at the time of testing (tested locally)
Round 1. Main Unity and CI
We have remarkable Native Performance tests which run on CI and report to a huge database. Let’s run the whole suite with outline atomics and without, and compare the results.
On a Shield, there’s a single change that’s worth mentioning: a slight regression in global_no_contention_Atomic_Add.
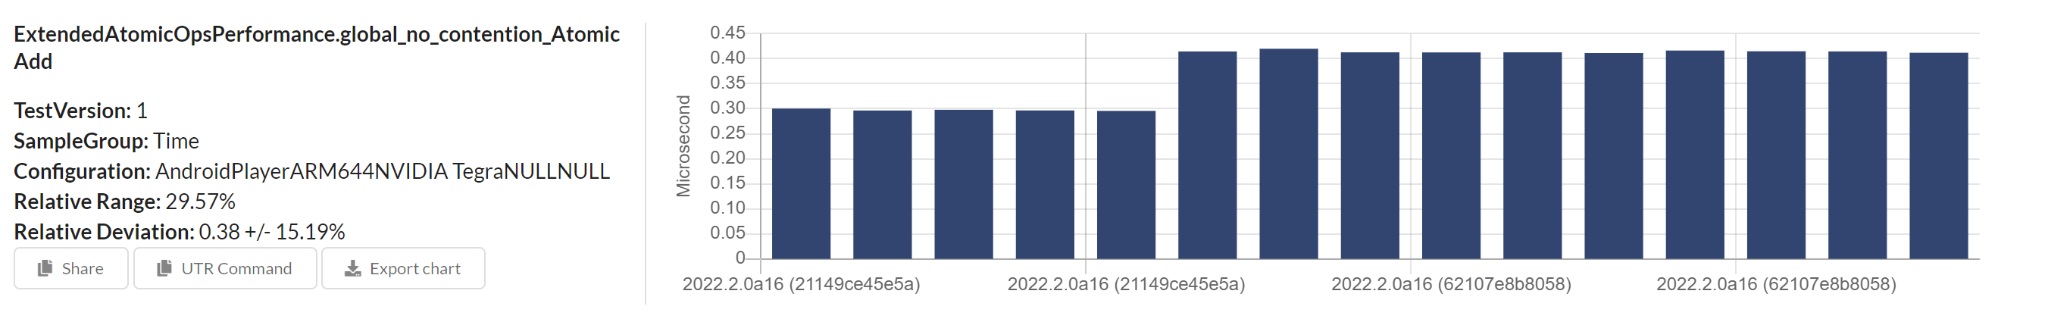
Few other regressions are most likely unrelated.
Let’s try on an LSE-capable device then. I’m running the tests locally and report data to the database.
The results are unfortunately quite unstable - and it partly relies on the fact that it’s running on a consumer device lying on my table. However, few results are curious.
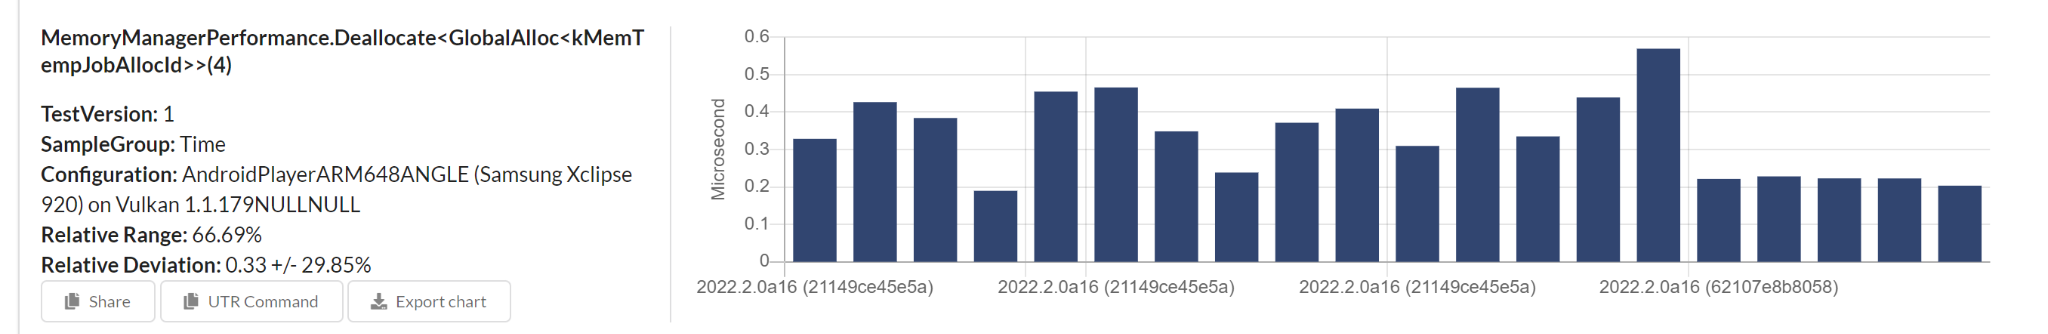
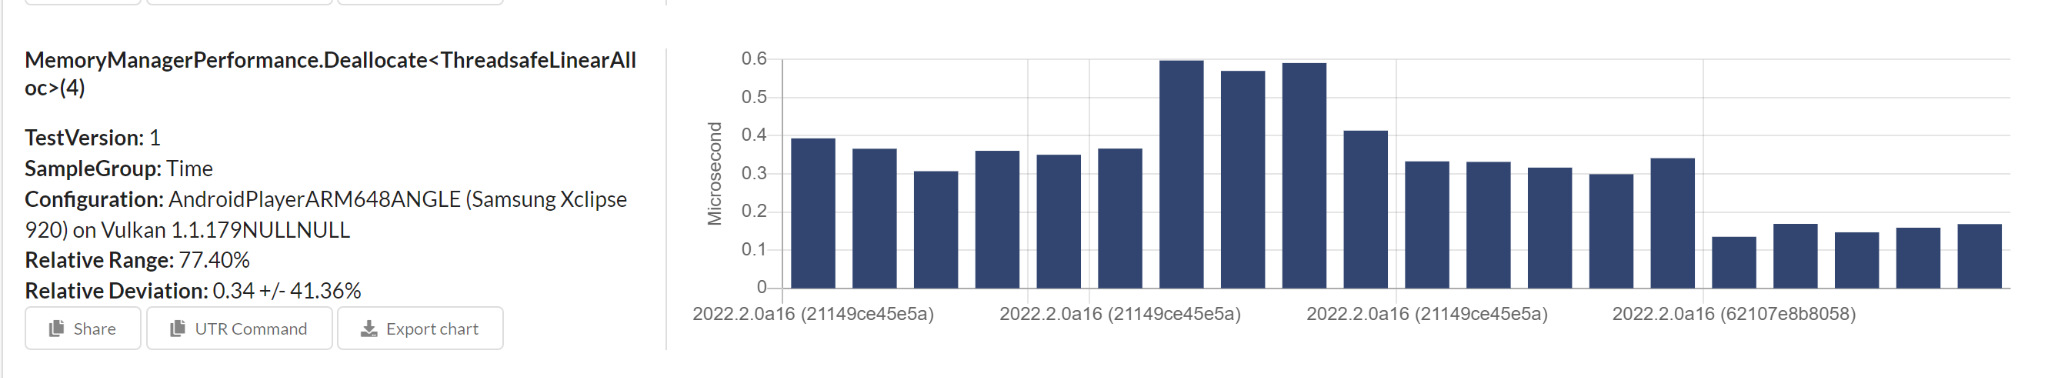
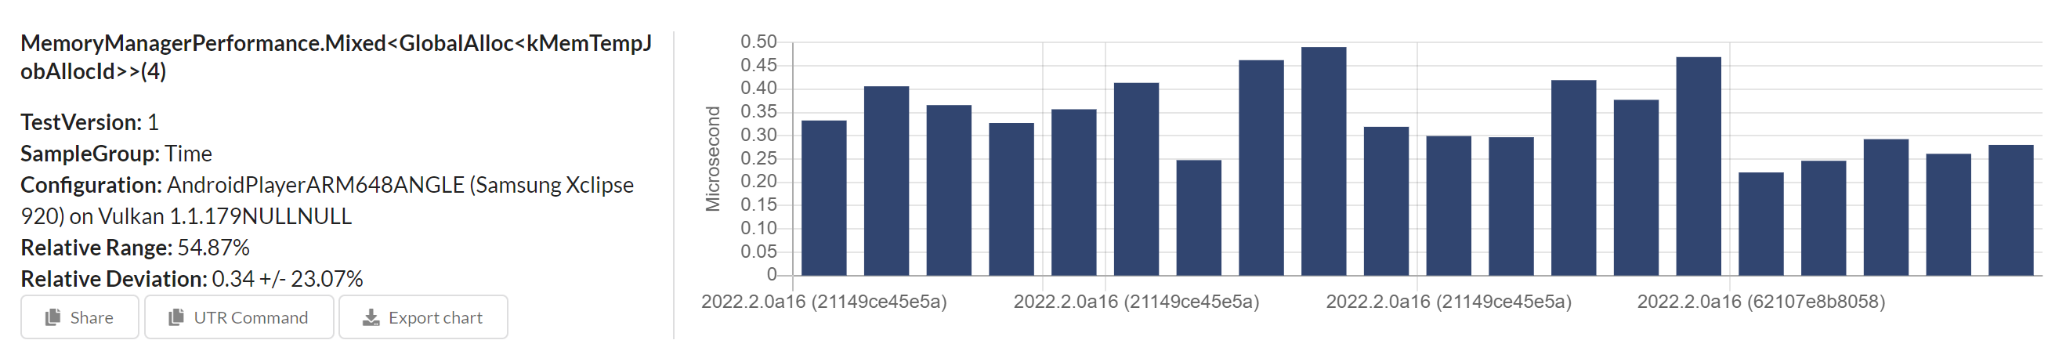
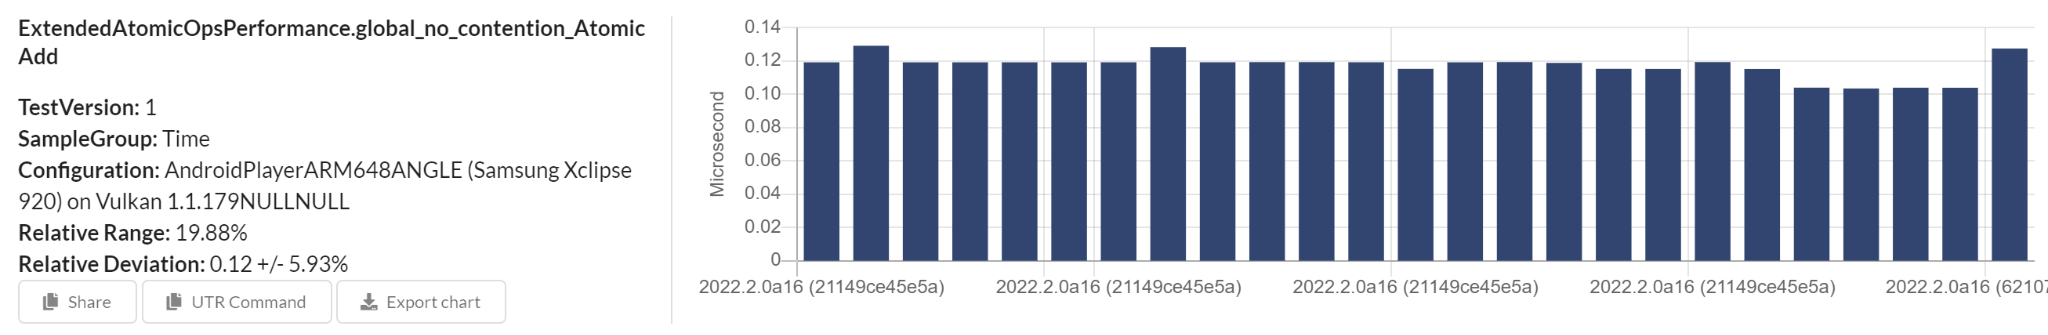
The global_no_contention_Atomic_Add which regressed on a Shield, shows an improvement on S22 (0.12 => 0.10ms). Some of the MemoryManagerPerformance tests improved significantly. Looks good so far!
Okay let’s now go to the code and try to understand what’s going on.
The Code
Of course, we have more than one atomics implementation in the Unity codebase. :(
- We have ExtendedAtomicOps-arm64.h. It uses explicit inline assembly which always generates oldschool LDXR/STXR instructions. Outline atomics have no effect on these, and they are used in quite a few places, which explains why there’s less effect to be measured all over the board.
- We have baselib’s atomics, which are a much more recent, platform-agnostic implementation using compiler instrinsics (GCC builtins, also implemented in LLVM). It is used in MemoryManager and other places, but currently has smaller adoption than the old ExtendedAtomicOps. This implementation benefits from LSE and outline atomics, which explains why there are gains in MemoryManager performance tests.
- Some places are still using std::atomic, which benefits from LSE/outline atomics too.
The overall strategy is to move as many consumers as possible to baselib, or to rewrite ExtendedAtomicOps to be a shim which redirects to baselib. LSE/outline atomics would benefit that.
However, if no regressions are found, it may be a good idea to adopt outline atomics now – and patiently wait for the future to come. It also means more motivation to move to baselib’s atomics all over the codebase.
Luckily, baselib has a set of benchmarks! Let’s run them and look at the results.
Round 2. Baselib Benchmarks
Baselib possesses a great collection of benchmarks, which cover all atomics use cases, plus collects the same results for std::atomics to use as a baseline.
The results of running the benchmarks on Galaxy S22 (LSE-capable) are available in the table below.
| Testcase | Benchmark | default, ns | outline, ns | Change |
|---|---|---|---|---|
| Baselib atomics (int64_t) | load(relaxed) | 0,000385595 | 0,000386961 | 0,35% |
| Baselib atomics (int64_t) | load(acquire) | 0,000385233 | 0,00039 | 1,24% |
| Baselib atomics (int64_t) | load(seq_cst) | 0,00039 | 0,00039125 | 0,32% |
| Baselib atomics (int64_t) | store(relaxed) | 0,000393934 | 0,000385104 | -2,24% |
| Baselib atomics (int64_t) | store(release) | 0,00039 | 0,000393064 | 0,79% |
| Baselib atomics (int64_t) | store(seq_cst) | 0,00039125 | 0,00039 | -0,32% |
| Baselib atomics (int64_t) | fetch_add(relaxed) | 5,72956 | 4,99676 | -12,79% |
| Baselib atomics (int64_t) | fetch_add(acquire) | 5,67628 | 4,95283 | -12,75% |
| Baselib atomics (int64_t) | fetch_add(release) | 5,68544 | 4,98981 | -12,24% |
| Baselib atomics (int64_t) | fetch_add(acq_rel) | 5,67653 | 4,9972 | -11,97% |
| Baselib atomics (int64_t) | fetch_add(seq_cst) | 7,27749 | 7,52526 | 3,40% |
| Baselib atomics (int64_t) | fetch_and(relaxed) | 5,67146 | 4,99698 | -11,89% |
| Baselib atomics (int64_t) | fetch_and(acquire) | 5,673 | 4,8902 | -13,80% |
| Baselib atomics (int64_t) | fetch_and(release) | 5,67463 | 4,92497 | -13,21% |
| Baselib atomics (int64_t) | fetch_and(acq_rel) | 5,72999 | 5,04349 | -11,98% |
| Baselib atomics (int64_t) | fetch_and(seq_cst) | 7,27855 | 7,50369 | 3,09% |
| Baselib atomics (int64_t) | fetch_or(relaxed) | 5,67244 | 4,99649 | -11,92% |
| Baselib atomics (int64_t) | fetch_or(acquire) | 5,67435 | 5,04275 | -11,13% |
| Baselib atomics (int64_t) | fetch_or(release) | 5,67056 | 4,95184 | -12,67% |
| Baselib atomics (int64_t) | fetch_or(acq_rel) | 5,69323 | 4,95234 | -13,01% |
| Baselib atomics (int64_t) | fetch_or(seq_cst) | 7,39012 | 7,53271 | 1,93% |
| Baselib atomics (int64_t) | fetch_xor(relaxed) | 5,72943 | 4,99723 | -12,78% |
| Baselib atomics (int64_t) | fetch_xor(acquire) | 5,72798 | 4,92503 | -14,02% |
| Baselib atomics (int64_t) | fetch_xor(release) | 5,67386 | 4,96399 | -12,51% |
| Baselib atomics (int64_t) | fetch_xor(acq_rel) | 5,67432 | 4,99725 | -11,93% |
| Baselib atomics (int64_t) | fetch_xor(seq_cst) | 7,27855 | 7,45118 | 2,37% |
| Baselib atomics (int64_t) | exchange(relaxed) | 0,000393206 | 0,00039125 | -0,50% |
| Baselib atomics (int64_t) | exchange(acquire) | 5,43095 | 5,04421 | -7,12% |
| Baselib atomics (int64_t) | exchange(release) | 0,00039125 | 0,000389176 | -0,53% |
| Baselib atomics (int64_t) | exchange(acq_rel) | 5,50492 | 5,05285 | -8,21% |
| Baselib atomics (int64_t) | exchange(seq_cst) | 7,23937 | 7,53526 | 4,09% |
| Baselib atomics (int64_t) | cmp_xchg_weak fail(relaxed. relaxed) | 5,2336 | 5,45062 | 4,15% |
| Baselib atomics (int64_t) | cmp_xchg_weak success(relaxed. relaxed) | 5,88586 | 5,419 | -7,93% |
| Baselib atomics (int64_t) | cmp_xchg_weak fail(acquire. relaxed) | 5,23867 | 5,39911 | 3,06% |
| Baselib atomics (int64_t) | cmp_xchg_weak success(acquire. relaxed) | 5,95429 | 5,46143 | -8,28% |
| Baselib atomics (int64_t) | cmp_xchg_weak fail(acquire. acquire) | 5,28305 | 5,39779 | 2,17% |
| Baselib atomics (int64_t) | cmp_xchg_weak success(acquire. acquire) | 5,95301 | 5,38517 | -9,54% |
| Baselib atomics (int64_t) | cmp_xchg_weak fail(release. relaxed) | 5,30522 | 5,45177 | 2,76% |
| Baselib atomics (int64_t) | cmp_xchg_weak success(release. relaxed) | 5,88906 | 5,41026 | -8,13% |
| Baselib atomics (int64_t) | cmp_xchg_weak fail(acq_rel. relaxed) | 5,23937 | 5,39805 | 3,03% |
| Baselib atomics (int64_t) | cmp_xchg_weak success(acq_rel. relaxed) | 5,9027 | 5,36478 | -9,11% |
| Baselib atomics (int64_t) | cmp_xchg_weak fail(acq_rel. acquire) | 5,2675 | 5,44287 | 3,33% |
| Baselib atomics (int64_t) | cmp_xchg_weak success(acq_rel. acquire) | 5,86618 | 5,39944 | -7,96% |
| Baselib atomics (int64_t) | cmp_xchg_weak fail(seq_cst. relaxed) | 5,16631 | 6,84211 | 32,44% |
| Baselib atomics (int64_t) | cmp_xchg_weak success(seq_cst. relaxed) | 7,54723 | 8,33851 | 10,48% |
| Baselib atomics (int64_t) | cmp_xchg_weak fail(seq_cst. acquire) | 5,34307 | 6,81893 | 27,62% |
| Baselib atomics (int64_t) | cmp_xchg_weak success(seq_cst. acquire) | 7,56281 | 8,30719 | 9,84% |
| Baselib atomics (int64_t) | cmp_xchg_weak fail(seq_cst. seq_cst) | 5,17506 | 7,59047 | 46,67% |
| Baselib atomics (int64_t) | cmp_xchg_weak success(seq_cst. seq_cst) | 5,5682 | 7,65737 | 37,52% |
| Baselib atomics (int64_t) | cmp_xchg_strong fail(relaxed. relaxed) | 5,21179 | 5,39832 | 3,58% |
| Baselib atomics (int64_t) | cmp_xchg_strong success(relaxed. relaxed) | 5,69832 | 5,42264 | -4,84% |
| Baselib atomics (int64_t) | cmp_xchg_strong fail(acquire. relaxed) | 5,23045 | 5,39779 | 3,20% |
| Baselib atomics (int64_t) | cmp_xchg_strong success(acquire. relaxed) | 5,83734 | 5,42521 | -7,06% |
| Baselib atomics (int64_t) | cmp_xchg_strong fail(acquire. acquire) | 5,21508 | 5,45208 | 4,54% |
| Baselib atomics (int64_t) | cmp_xchg_strong success(acquire. acquire) | 5,87539 | 5,40666 | -7,98% |
| Baselib atomics (int64_t) | cmp_xchg_strong fail(release. relaxed) | 5,24858 | 5,45319 | 3,90% |
| Baselib atomics (int64_t) | cmp_xchg_strong success(release. relaxed) | 5,78798 | 5,41572 | -6,43% |
| Baselib atomics (int64_t) | cmp_xchg_strong fail(acq_rel. relaxed) | 5,24169 | 5,39858 | 2,99% |
| Baselib atomics (int64_t) | cmp_xchg_strong success(acq_rel. relaxed) | 5,77166 | 5,46338 | -5,34% |
| Baselib atomics (int64_t) | cmp_xchg_strong fail(acq_rel. acquire) | 5,22574 | 5,39832 | 3,30% |
| Baselib atomics (int64_t) | cmp_xchg_strong success(acq_rel. acquire) | 5,66156 | 5,38044 | -4,97% |
| Baselib atomics (int64_t) | cmp_xchg_strong fail(seq_cst. relaxed) | 5,31198 | 6,82313 | 28,45% |
| Baselib atomics (int64_t) | cmp_xchg_strong success(seq_cst. relaxed) | 7,60092 | 8,2542 | 8,59% |
| Baselib atomics (int64_t) | cmp_xchg_strong fail(seq_cst. acquire) | 5,3248 | 6,84395 | 28,53% |
| Baselib atomics (int64_t) | cmp_xchg_strong success(seq_cst. acquire) | 7,48102 | 8,25419 | 10,34% |
| Baselib atomics (int64_t) | cmp_xchg_strong fail(seq_cst. seq_cst) | 5,24991 | 7,65791 | 45,87% |
| Baselib atomics (int64_t) | cmp_xchg_strong success(seq_cst. seq_cst) | 7,41788 | 7,63039 | 2,86% |
| std::atomic (int64_t) | load(relaxed) | 0,00039 | 0,00039 | 0,00% |
| std::atomic (int64_t) | load(acquire) | 0,00039 | 0,00039 | 0,00% |
| std::atomic (int64_t) | load(seq_cst) | 0,0003925 | 0,000395796 | 0,84% |
| std::atomic (int64_t) | store(relaxed) | 0,00039 | 0,0003925 | 0,64% |
| std::atomic (int64_t) | store(release) | 0,00039125 | 0,00039 | -0,32% |
| std::atomic (int64_t) | store(seq_cst) | 0,00039125 | 0,00039 | -0,32% |
| std::atomic (int64_t) | fetch_add(relaxed) | 5,76841 | 5,04124 | -12,61% |
| std::atomic (int64_t) | fetch_add(acquire) | 5,67638 | 5,23763 | -7,73% |
| std::atomic (int64_t) | fetch_add(release) | 5,71074 | 5,21996 | -8,59% |
| std::atomic (int64_t) | fetch_add(acq_rel) | 5,68082 | 5,17513 | -8,90% |
| std::atomic (int64_t) | fetch_add(seq_cst) | 5,71148 | 5,25163 | -8,05% |
| std::atomic (int64_t) | fetch_and(relaxed) | 5,76754 | 5,06334 | -12,21% |
| std::atomic (int64_t) | fetch_and(acquire) | 5,68766 | 5,17591 | -9,00% |
| std::atomic (int64_t) | fetch_and(release) | 5,70922 | 5,23549 | -8,30% |
| std::atomic (int64_t) | fetch_and(acq_rel) | 5,76538 | 5,23106 | -9,27% |
| std::atomic (int64_t) | fetch_and(seq_cst) | 5,71144 | 5,20844 | -8,81% |
| std::atomic (int64_t) | fetch_or(relaxed) | 5,71144 | 5,06334 | -11,35% |
| std::atomic (int64_t) | fetch_or(acquire) | 5,67575 | 5,17685 | -8,79% |
| std::atomic (int64_t) | fetch_or(release) | 5,70869 | 5,17661 | -9,32% |
| std::atomic (int64_t) | fetch_or(acq_rel) | 5,71081 | 5,21962 | -8,60% |
| std::atomic (int64_t) | fetch_or(seq_cst) | 5,71097 | 5,2925 | -7,33% |
| std::atomic (int64_t) | fetch_xor(relaxed) | 5,76597 | 5,04114 | -12,57% |
| std::atomic (int64_t) | fetch_xor(acquire) | 5,71112 | 5,1749 | -9,39% |
| std::atomic (int64_t) | fetch_xor(release) | 5,71097 | 5,28538 | -7,45% |
| std::atomic (int64_t) | fetch_xor(acq_rel) | 5,76538 | 5,25347 | -8,88% |
| std::atomic (int64_t) | fetch_xor(seq_cst) | 5,71125 | 5,209 | -8,79% |
| std::atomic (int64_t) | exchange(relaxed) | 0,713731 | 0,720574 | 0,96% |
| std::atomic (int64_t) | exchange(acquire) | 5,52406 | 5,2086 | -5,71% |
| std::atomic (int64_t) | exchange(release) | 1,42757 | 1,78423 | 24,98% |
| std::atomic (int64_t) | exchange(acq_rel) | 5,48457 | 5,17565 | -5,63% |
| std::atomic (int64_t) | exchange(seq_cst) | 5,52522 | 5,17559 | -6,33% |
| std::atomic (int64_t) | cmp_xchg_weak(relaxed. relaxed) fail | 5,28103 | 6,86618 | 30,02% |
| std::atomic (int64_t) | cmp_xchg_weak(relaxed. relaxed) success | 5,57233 | 6,65872 | 19,50% |
| std::atomic (int64_t) | cmp_xchg_weak(acquire. relaxed) fail | 5,32297 | 7,65681 | 43,84% |
| std::atomic (int64_t) | cmp_xchg_weak(acquire. relaxed) success | 5,55278 | 7,04572 | 26,89% |
| std::atomic (int64_t) | cmp_xchg_weak(acquire. acquire) fail | 5,19573 | 7,5397 | 45,11% |
| std::atomic (int64_t) | cmp_xchg_weak(acquire. acquire) success | 5,65387 | 7,06106 | 24,89% |
| std::atomic (int64_t) | cmp_xchg_weak(release. relaxed) fail | 5,16921 | 8,64542 | 67,25% |
| std::atomic (int64_t) | cmp_xchg_weak(release. relaxed) success | 5,8789 | 8,09059 | 37,62% |
| std::atomic (int64_t) | cmp_xchg_weak(acq_rel. relaxed) fail | 5,14874 | 8,4178 | 63,49% |
| std::atomic (int64_t) | cmp_xchg_weak(acq_rel. relaxed) success | 5,62648 | 8,15887 | 45,01% |
| std::atomic (int64_t) | cmp_xchg_weak(acq_rel. acquire) fail | 5,19702 | 8,41399 | 61,90% |
| std::atomic (int64_t) | cmp_xchg_weak(acq_rel. acquire) success | 5,61241 | 8,0948 | 44,23% |
| std::atomic (int64_t) | cmp_xchg_weak(seq_cst. relaxed) fail | 5,6107 | 8,45259 | 50,65% |
| std::atomic (int64_t) | cmp_xchg_weak(seq_cst. relaxed) success | 5,74546 | 8,06755 | 40,42% |
| std::atomic (int64_t) | cmp_xchg_weak(seq_cst. acquire) fail | 5,19561 | 8,4248 | 62,15% |
| std::atomic (int64_t) | cmp_xchg_weak(seq_cst. acquire) success | 5,83114 | 8,08243 | 38,61% |
| std::atomic (int64_t) | cmp_xchg_weak(seq_cst. seq_cst) fail | 5,44959 | 8,5268 | 56,47% |
| std::atomic (int64_t) | cmp_xchg_weak(seq_cst. seq_cst) success | 5,68065 | 8,06806 | 42,03% |
| std::atomic (int64_t) | cmp_xchg_strong(relaxed. relaxed) fail | 5,37833 | 6,92512 | 28,76% |
| std::atomic (int64_t) | cmp_xchg_strong(relaxed. relaxed) success | 5,59084 | 6,70653 | 19,96% |
| std::atomic (int64_t) | cmp_xchg_strong(acquire. relaxed) fail | 5,22344 | 7,39602 | 41,59% |
| std::atomic (int64_t) | cmp_xchg_strong(acquire. relaxed) success | 5,53385 | 7,11215 | 28,52% |
| std::atomic (int64_t) | cmp_xchg_strong(acquire. acquire) fail | 5,19899 | 7,37137 | 41,78% |
| std::atomic (int64_t) | cmp_xchg_strong(acquire. acquire) success | 5,71289 | 7,13459 | 24,89% |
| std::atomic (int64_t) | cmp_xchg_strong(release. relaxed) fail | 5,18419 | 8,51836 | 64,31% |
| std::atomic (int64_t) | cmp_xchg_strong(release. relaxed) success | 5,62459 | 8,22757 | 46,28% |
| std::atomic (int64_t) | cmp_xchg_strong(acq_rel. relaxed) fail | 5,17071 | 8,19045 | 58,40% |
| std::atomic (int64_t) | cmp_xchg_strong(acq_rel. relaxed) success | 5,7873 | 8,10029 | 39,97% |
| std::atomic (int64_t) | cmp_xchg_strong(acq_rel. acquire) fail | 5,16332 | 8,22449 | 59,29% |
| std::atomic (int64_t) | cmp_xchg_strong(acq_rel. acquire) success | 5,87045 | 8,11597 | 38,25% |
| std::atomic (int64_t) | cmp_xchg_strong(seq_cst. relaxed) fail | 5,57339 | 8,15235 | 46,27% |
| std::atomic (int64_t) | cmp_xchg_strong(seq_cst. relaxed) success | 5,67978 | 8,15304 | 43,54% |
| std::atomic (int64_t) | cmp_xchg_strong(seq_cst. acquire) fail | 5,19931 | 8,14173 | 56,59% |
| std::atomic (int64_t) | cmp_xchg_strong(seq_cst. acquire) success | 5,75014 | 8,08624 | 40,63% |
| std::atomic (int64_t) | cmp_xchg_strong(seq_cst. seq_cst) fail | 5,51236 | 8,15659 | 47,97% |
| std::atomic (int64_t) | cmp_xchg_strong(seq_cst. seq_cst) success | 5,63752 | 8,13753 | 44,35% |
Most important observations are:
- baselib’s fetch_[op], exchange, compare-and-exchange show a clear improvement of some 10-20% - which is expected – and is a great result!
- Operations with SEQ_CST memory model show a much worse improvement and even regressions in some cases! Needs investigation.
- std::atomic has significantly regressed in compare_exchange_weak and compare_exchange_strong operations.
Round 3. Mandatory assembly check!
Okay, now let’s try to find out what’s happening behind the scenes and try to explain the performance results on SEQ_CST operations.
Here’s an example outline-atomics function:
00000000007a3d60 <__aarch64_cas4_acq_rel>:
  7a3d60: 5f 24 03 d5  	hint	#34
  7a3d64: 10 01 00 90  	adrp	x16, 0x7c3000 <__aarch64_cas8_acq+0x4>
  7a3d68: 10 42 43 39  	ldrb	w16, [x16, #208]
  7a3d6c: 70 00 00 34  	cbz	w16, 0x7a3d78 <__aarch64_cas4_acq_rel+0x18>
  7a3d70: 41 fc e0 88  	casal	w0, w1, [x2]
  7a3d74: c0 03 5f d6  	ret
  7a3d78: f0 03 00 2a  	mov	w16, w0
  7a3d7c: 40 fc 5f 88  	ldaxr	w0, [x2]
  7a3d80: 1f 00 10 6b  	cmp	w0, w16
  7a3d84: 61 00 00 54  	b.ne	0x7a3d90 <__aarch64_cas4_acq_rel+0x30>
  7a3d88: 41 fc 11 88  	stlxr	w17, w1, [x2]
  7a3d8c: 91 ff ff 35  	cbnz	w17, 0x7a3d7c <__aarch64_cas4_acq_rel+0x1c>
  7a3d90: c0 03 5f d6  	ret
It has the branch on CPU capabilities (cbz), LSE implementation (casal) and LL/SC (ldaxr/stlxr).
The call site looks something like this:
  4f4170: c0 fd 9f 52  	mov	w0, #65518
  4f4174: c1 fd 9f 52  	mov	w1, #65518
  4f4178: e2 b3 04 91  	add	x2, sp, #300
  4f417c: e0 ff af 72  	movk	w0, #32767, lsl #16
  4f4180: e1 ff af 72  	movk	w1, #32767, lsl #16
  4f4184: f7 be 0a 94  	bl	0x7a3d60 <__aarch64_cas4_acq_rel>
>>4f4188: bf 3b 03 d5  	dmb	ish
Highlighted is the full memory barrier generated by baselib when SEQ_CST is used. The corresponding code in baselib has this curious comment:
// Patch gcc and clang intrinsics to achieve a sequentially consistent barrier.
// As of writing Clang 9, GCC 9 none of them produce a seq cst barrier for load-store operations.
// To fix this we switch load store to be acquire release with a full final barrier.
However, after a lengthy discussion afterwards with the folks who wrote the code and our friends at Arm, as well as reading up on the research papers in the internets https://plv.mpi-sws.org/scfix/paper.pdf and https://www.open-std.org/jtc1/sc22/wg21/docs/papers/2018/p0668r5.html, https://community.arm.com/arm-community-blogs/b/tools-software-ides-blog/posts/armv8-sequential-consistency, we came to a conclusion that the full memory barrier is too conservative for this case. The full memory barrier is needed for legacy __sync GCC builtins though. We’ll be fixing the SEQ_CST atomics in baselib by removing the barrier and re-measuring performance of outline atomics, if time permits.
Here’s the assembly from LL/SC atomic version to compare:
  4fbb28: 09 fd 5f 88  	ldaxr	w9, [x8]
  4fbb2c: 3f 01 19 6b  	cmp	w9, w25
  4fbb30: 61 00 00 54  	b.ne	0x4fbb3c
  4fbb34: 17 fd 09 88  	stlxr	w9, w23, [x8]
  4fbb38: 02 00 00 14  	b	0x4fbb40
  4fbb3c: 5f 3f 03 d5  	clrex
  4fbb40: bf 3b 03 d5  	dmb	ish
Looks pretty logical and neat (mind the memory barrier).
Why is outline-atomics code slower than pure LL/SC, taken that both have the barrier? It couldn’t be just a function call (branch-and-link) overhead, can it? Let’s jump deeper, into a sampling profiler…
Round 4. Profiling benchmarks
There are two goals to be achieved with a sampling profiler: first, confirm that LSE path is taken; second, try to find out where most time is spent on.
I’m usually sticking to Arm Mobile Studio (Arm Streamline) as a sampling profiler, but since baselib benchmarks are an ELF application and not an APK, I didn’t find a way to profile it out of box in Streamline.
UPDATE: I got a follow-up from Pete Harris @ Arm:
“It works – a little manual setup, but it’s not too painful.
- Push the binary you want to test and gatord to
/data/local/tmp - From android device shell in
/data/local/tmp: - Run
setprop security.perf_harden 0 - Run
./gatord --app <app name> <app command line args>. This will pause and wait for the host tool to connect before starting the app
From the host tool:
- In the “Start” tab select “TCP (advanced)”
- Select the Android device in the device table
- Configure counters and “Start” when ready (The Configure application part of this doesn’t work for Android) Once captured, right click on the capture in the “Streamline Data” tab and select “Analyze”. Add the ELF images / symbol files you need and reanalyze.”
So it’s doable in Streamline too, but this time I used Google’s simpleperf bundled in Android NDK instead. The “native program” option -np is specially designed for such cases.
Here’s the answer to the first question:
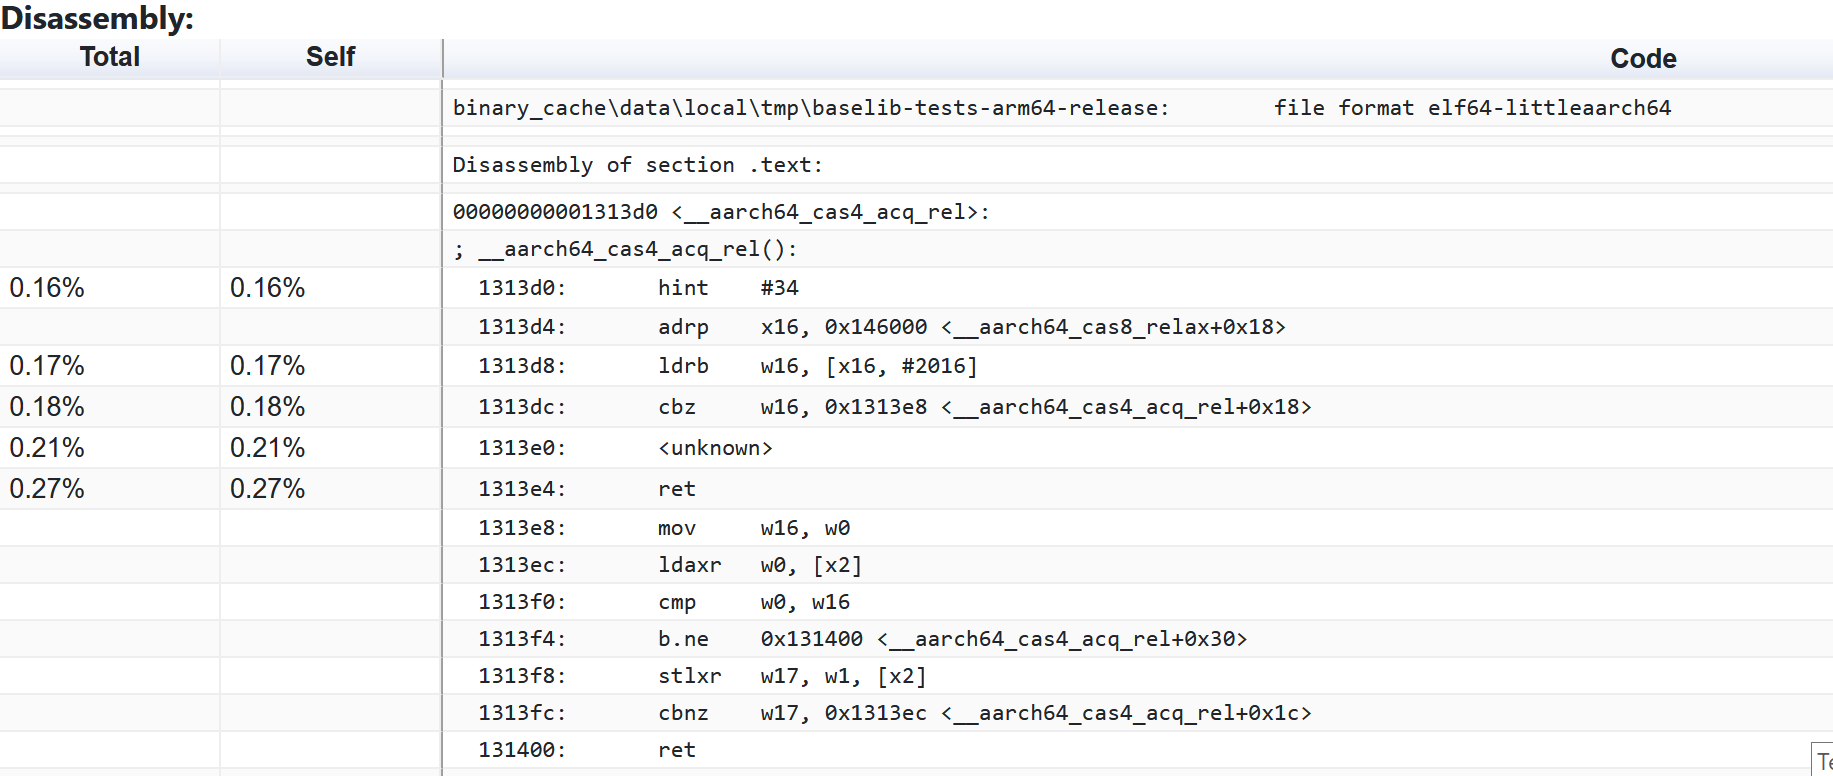
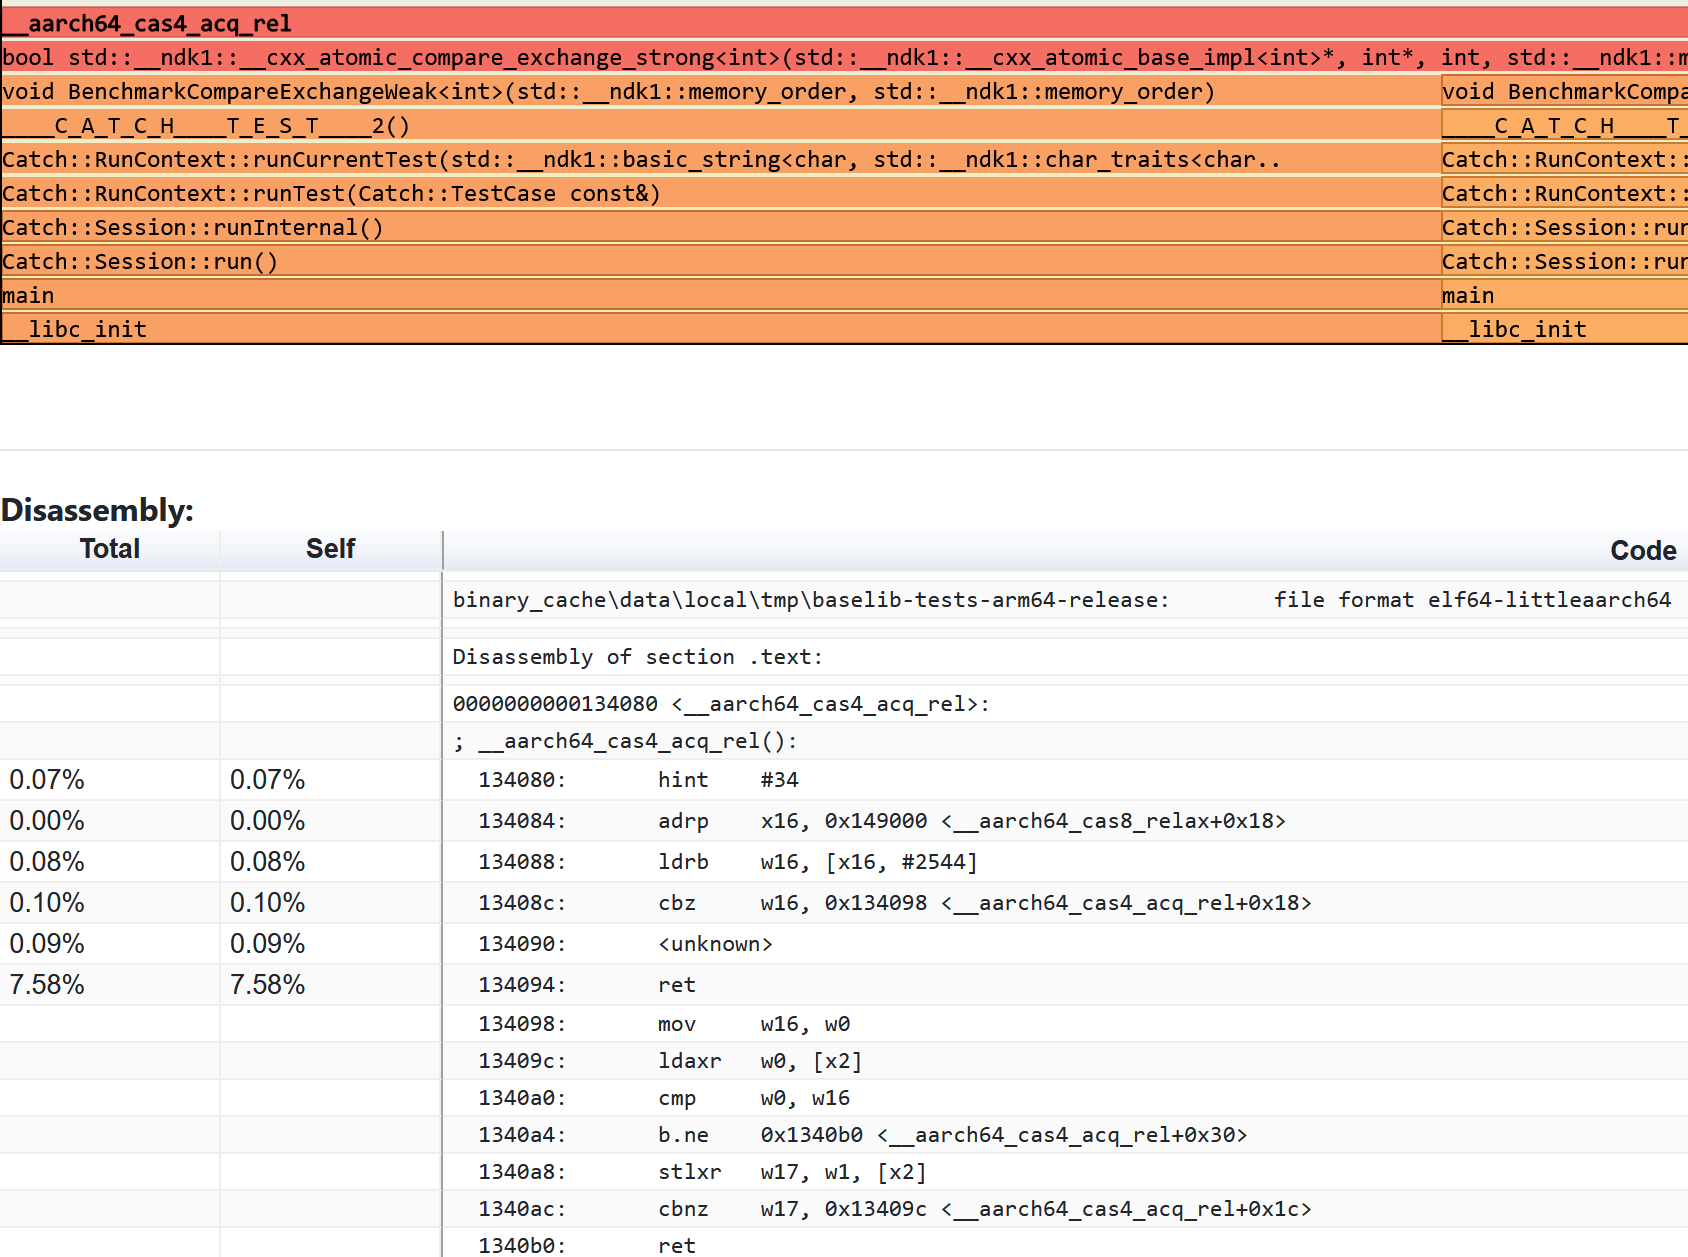
Yes, runtime detection is working correctly. Yes, LSE instructions are being used (in this particular case, <unknown> is cas* - compare-and-swap instruction, simpleperf didn’t enable new extensions when dumping disassembly, hint #34 is a PAC instruction paciasp). Yes, they are quite fast – no clear bottleneck, even if the interrupts were not 100% precise because the microarchitecture prefers to not stop at this or that instruction. No issues found here.
Next, let’s check the profile of the call site.
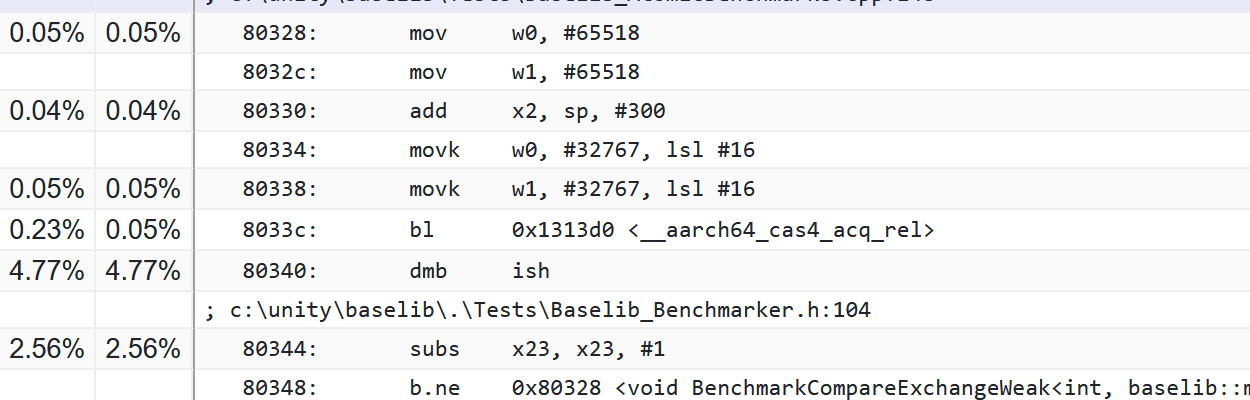
It is unlikely that subs takes that much CPU time. Maybe the CPU interrupts are one instruction off here, but it could also be a side effect of the full memory barrier that the next instruction has to wait longer than expected. Anyway, most of the time is being spent in the memory barrier and around it, which doesn’t really answer the question – why is it performing slower than a non-LSE version?
Here’s to the assembly of LL/SC version:
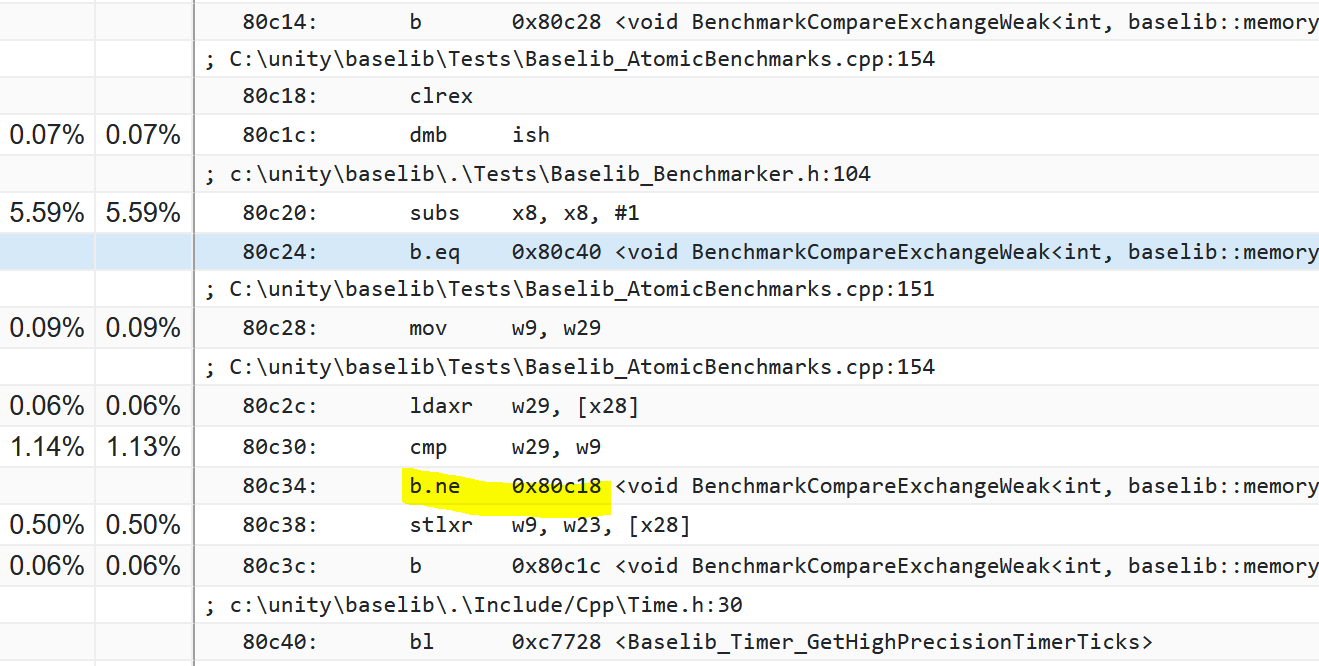
(please disregard the yellow markup)
This one seems to spend most of its time in subs and very little in the memory barrier - which we could once again attribute to microarchitecture preferences, but this assumption is speculative.
Anyway, there is no clear answer as to where the time is spent in the LSE version compared to the LL/SC version when a full memory barrier is in place. I can only state that the outline-atomics version is slower – maybe it’s related to a sequence of function call => memory barrier => arithmetic with flag setting.
Taken that we later decided to remove the full memory barrier from baselib’s SEQ_CST implementations, this regression becomes much less significant.
Round 5. STL atomics: weak or strong?
STL’s std::atomic performance is used in baselib as a baseline, but it’s still curious to find out why it has become slower with outline-atomics than without them.
When using LL/SC, the benchmark calls into
__cxx_atomic_compare_exchange_weak<int>(),
but when with -moutline-atomics, for some reason it becomes a strong exchange
__cxx_atomic_compare_exchange_strong<int>()
which is significantly slower (almost by half).
First I thought there’s a bug in the benchmark, but no, it’s correct.
When I remove strong compare-and-exchange from the benchmark, the assembly shows calls into the weak version in STL, which is correct! When there are calls to weak and strong versions of STL atomics, then only strong seems to be used. This hints of identical code folding (ICF), but why is it happening?
Since our code is using catch benchmarking, I first thought it’s to blame. Looking at the resulting code after all preprocessors run, I see lambdas
holder = [&]()
    {
        T prev = value2;
        memory.compare_exchange_strong(prev, value2, order1, order2);
    };
holder = [&]()
    {
        T prev = value2;
        memory.compare_exchange_weak(prev, value2, order1, order2);
    };
so I thought maybe it’s lambdas which fold. However, by tuning input and tests here and there, I was able to dump the assembly of the STL’s weak and strong versions with outline enabled.
bool std::__ndk1::__cxx_atomic_compare_exchange_strong<int>(std::__ndk1::__cxx_atomic_base_impl<int>*, int*, int, std::__ndk1::memory_order, std::__ndk1::memory_order)
bool std::__ndk1::__cxx_atomic_compare_exchange_weak<int>(std::__ndk1::__cxx_atomic_base_impl<int>*, int*, int, std::__ndk1::memory_order, std::__ndk1::memory_order)
They are identical (apart from branch addresses)! This answers the question why LLVM folded the two functions into one. I thought okay, maybe it’s an NDK bug – so I tried the latest (at the time) r25beta4. Same result. The code itself is different from r23, but weak and strong versions in r25 are the same.
Trying to isolate it, I created this repro in godbolt. The assembly with outline intrinsics is identical in strong and weak versions.
With LL/SC, the assembly does differ, having stxr vs. stlxr instruction.
I raised the question with Arm compiler folks, and we found out that the pure LSE versions for weak and strong exchange are exactly the same (confirmed in godbolt). The outline atomics version just builds upon an LSE version, so they are still the same. Doesn’t explain the regression, the LSE instructions must be faster than LL/SC, regardless weak or strong.
The profile confirms that LSE is actually used:
Overall, some of baselib’s std::atomic benchmarks show performance regressions in outline atomics vs. LL/SC versions on LSE-capable devices. This shouldn’t happen. We spent some time with out friends at Arm investigating this, and I’ll share results in a separate post.
Round 6. Pure LSE
Let’s find out what is the cost related to the function call overhead and CPU capabilities branch introduced by the outline atomics implementation. To remove the function call overhead, we’re building a binary which has atomics implemented in pure inlined LSE instructions.
At first, I tried obtaining some skills in writing inline assembly in C, but after few hours I realized that I can just compile using -march=armv8-a+lse, and the compiler will do the job for me automatically! Of course, such a binary can only run on an LSE-capable device, and will generate an illegal instruction exception on an older device (verified locally).
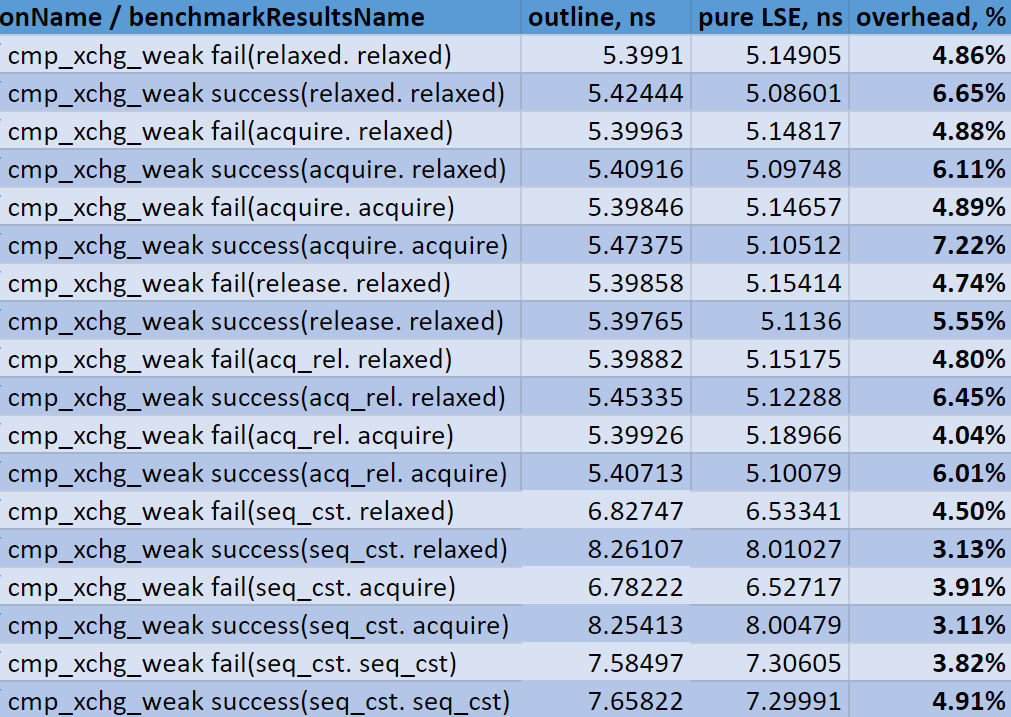
Now, on to performance. Selected benchmark results are available in the table below.
Results:
- As expected, pure LSE is always faster than outline atomics
- Absolute overhead of having to call the intrinsic function with outline atomics and check the boolean containing CPU capabilities lies in the range of 0.2-0.3 ns
- Relative overhead varies from 3 to 7%.
Overall, the result is expected: the overhead is there, but it’s not very high. The performance benefits LSE brings are definitely higher than that.
Round 7. Benchmarking outline atomics on old, non-LSE devices
The test device for local tests was Huawei Honor 9 (Cortex A53).
| Testcase | Benchmark | default, ns | outline, ns | Change |
|---|---|---|---|---|
| Baselib atomics (int64_t) | fetch_add(relaxed) | 8,7645 | 13,472 | 53,71% |
| Baselib atomics (int64_t) | fetch_add(acquire) | 8,7609 | 13,509 | 54,20% |
| Baselib atomics (int64_t) | fetch_add(release) | 9,434 | 14,158 | 50,07% |
| Baselib atomics (int64_t) | fetch_add(acq_rel) | 9,4301 | 14,139 | 49,93% |
| Baselib atomics (int64_t) | fetch_add(seq_cst) | 12,126 | 14,821 | 22,22% |
| Baselib atomics (int64_t) | fetch_and(relaxed) | 8,7579 | 13,479 | 53,91% |
| Baselib atomics (int64_t) | fetch_and(acquire) | 8,7507 | 13,483 | 54,08% |
| Baselib atomics (int64_t) | fetch_and(release) | 9,4248 | 14,155 | 50,19% |
| Baselib atomics (int64_t) | fetch_and(acq_rel) | 9,4281 | 14,25 | 51,14% |
| Baselib atomics (int64_t) | fetch_and(seq_cst) | 12,12 | 14,827 | 22,33% |
| Baselib atomics (int64_t) | fetch_or(relaxed) | 8,7657 | 13,474 | 53,71% |
| Baselib atomics (int64_t) | fetch_or(acquire) | 8,7623 | 13,477 | 53,81% |
| Baselib atomics (int64_t) | fetch_or(release) | 9,4364 | 14,152 | 49,97% |
| Baselib atomics (int64_t) | fetch_or(acq_rel) | 9,4307 | 14,164 | 50,19% |
| Baselib atomics (int64_t) | fetch_or(seq_cst) | 12,133 | 14,829 | 22,22% |
| Baselib atomics (int64_t) | fetch_xor(relaxed) | 8,7602 | 13,472 | 53,79% |
| Baselib atomics (int64_t) | fetch_xor(acquire) | 8,7708 | 13,49 | 53,81% |
| Baselib atomics (int64_t) | fetch_xor(release) | 9,475 | 14,254 | 50,44% |
| Baselib atomics (int64_t) | fetch_xor(acq_rel) | 9,4521 | 14,145 | 49,65% |
| Baselib atomics (int64_t) | fetch_xor(seq_cst) | 12,134 | 14,84 | 22,30% |
| Baselib atomics (int64_t) | exchange(relaxed) | 0,00017724 | 0,00017163 | -3,17% |
| Baselib atomics (int64_t) | exchange(acquire) | 8,7589 | 13,469 | 53,78% |
| Baselib atomics (int64_t) | exchange(release) | 0,00017292 | 0,00017162 | -0,75% |
| Baselib atomics (int64_t) | exchange(acq_rel) | 10,784 | 15,503 | 43,76% |
| Baselib atomics (int64_t) | exchange(seq_cst) | 12,142 | 16,176 | 33,22% |
| Baselib atomics (int64_t) | cmp_xchg_weak fail(relaxed,relaxed) | 4,7 | 12,808 | 172,51% |
| Baselib atomics (int64_t) | cmp_xchg_weak success(relaxed,relaxed) | 8,094 | 14,168 | 75,04% |
| Baselib atomics (int64_t) | cmp_xchg_weak fail(acquire,relaxed) | 4,723 | 11,465 | 142,75% |
| Baselib atomics (int64_t) | cmp_xchg_weak success(acquire,relaxed) | 8,0849 | 14,251 | 76,27% |
| Baselib atomics (int64_t) | cmp_xchg_weak fail(acquire,acquire) | 4,716 | 12,806 | 171,54% |
| Baselib atomics (int64_t) | cmp_xchg_weak success(acquire,acquire) | 8,0929 | 14,159 | 74,96% |
| Baselib atomics (int64_t) | cmp_xchg_weak fail(release,relaxed) | 4,7166 | 11,454 | 142,84% |
| Baselib atomics (int64_t) | cmp_xchg_weak success(release,relaxed) | 8,7658 | 14,822 | 69,09% |
| Baselib atomics (int64_t) | cmp_xchg_weak fail(acq_rel,relaxed) | 4,7171 | 12,797 | 171,29% |
| Baselib atomics (int64_t) | cmp_xchg_weak success(acq_rel,relaxed) | 8,7552 | 14,828 | 69,36% |
| Baselib atomics (int64_t) | cmp_xchg_weak fail(acq_rel,acquire) | 4,7161 | 11,442 | 142,62% |
| Baselib atomics (int64_t) | cmp_xchg_weak success(acq_rel,acquire) | 8,7553 | 14,824 | 69,31% |
| Baselib atomics (int64_t) | cmp_xchg_weak fail(seq_cst,relaxed) | 4,7327 | 12,9 | 172,57% |
| Baselib atomics (int64_t) | cmp_xchg_weak success(seq_cst,relaxed) | 13,471 | 16,173 | 20,06% |
| Baselib atomics (int64_t) | cmp_xchg_weak fail(seq_cst,acquire) | 4,7116 | 14,16 | 200,53% |
| Baselib atomics (int64_t) | cmp_xchg_weak success(seq_cst,acquire) | 13,479 | 16,189 | 20,11% |
| Baselib atomics (int64_t) | cmp_xchg_weak fail(seq_cst,seq_cst) | 7,4291 | 12,812 | 72,46% |
| Baselib atomics (int64_t) | cmp_xchg_weak success(seq_cst,seq_cst) | 12,132 | 15,492 | 27,70% |
| Baselib atomics (int64_t) | cmp_xchg_strong fail(relaxed,relaxed) | 4,7175 | 11,465 | 143,03% |
| Baselib atomics (int64_t) | cmp_xchg_strong success(relaxed,relaxed) | 10,103 | 14,152 | 40,08% |
| Baselib atomics (int64_t) | cmp_xchg_strong fail(acquire,relaxed) | 4,7216 | 12,803 | 171,16% |
| Baselib atomics (int64_t) | cmp_xchg_strong success(acquire,relaxed) | 10,11 | 14,241 | 40,86% |
| Baselib atomics (int64_t) | cmp_xchg_strong fail(acquire,acquire) | 4,7157 | 11,468 | 143,19% |
| Baselib atomics (int64_t) | cmp_xchg_strong success(acquire,acquire) | 10,113 | 14,161 | 40,03% |
| Baselib atomics (int64_t) | cmp_xchg_strong fail(release,relaxed) | 4,7336 | 12,828 | 171,00% |
| Baselib atomics (int64_t) | cmp_xchg_strong success(release,relaxed) | 10,774 | 14,813 | 37,49% |
| Baselib atomics (int64_t) | cmp_xchg_strong fail(acq_rel,relaxed) | 4,7194 | 11,46 | 142,83% |
| Baselib atomics (int64_t) | cmp_xchg_strong success(acq_rel,relaxed) | 10,8 | 14,842 | 37,43% |
| Baselib atomics (int64_t) | cmp_xchg_strong fail(acq_rel,acquire) | 4,715 | 12,8 | 171,47% |
| Baselib atomics (int64_t) | cmp_xchg_strong success(acq_rel,acquire) | 10,776 | 14,821 | 37,54% |
| Baselib atomics (int64_t) | cmp_xchg_strong fail(seq_cst,relaxed) | 4,7202 | 14,24 | 201,68% |
| Baselib atomics (int64_t) | cmp_xchg_strong success(seq_cst,relaxed) | 13,486 | 16,179 | 19,97% |
| Baselib atomics (int64_t) | cmp_xchg_strong fail(seq_cst,acquire) | 4,7181 | 12,824 | 171,80% |
| Baselib atomics (int64_t) | cmp_xchg_strong success(seq_cst,acquire) | 13,485 | 16,189 | 20,05% |
| Baselib atomics (int64_t) | cmp_xchg_strong fail(seq_cst,seq_cst) | 7,4121 | 12,154 | 63,98% |
| Baselib atomics (int64_t) | cmp_xchg_strong success(seq_cst,seq_cst) | 12,801 | 15,5 | 21,08% |
| std::atomic (int64_t) | fetch_add(relaxed) | 10,111 | 14,226 | 40,70% |
| std::atomic (int64_t) | fetch_add(acquire) | 12,807 | 17,533 | 36,90% |
| std::atomic (int64_t) | fetch_add(release) | 13,485 | 18,209 | 35,03% |
| std::atomic (int64_t) | fetch_add(acq_rel) | 13,464 | 17,523 | 30,15% |
| std::atomic (int64_t) | fetch_add(seq_cst) | 13,469 | 17,535 | 30,19% |
| std::atomic (int64_t) | fetch_and(relaxed) | 10,121 | 14,14 | 39,71% |
| std::atomic (int64_t) | fetch_and(acquire) | 12,819 | 17,543 | 36,85% |
| std::atomic (int64_t) | fetch_and(release) | 13,464 | 18,29 | 35,84% |
| std::atomic (int64_t) | fetch_and(acq_rel) | 13,506 | 17,521 | 29,73% |
| std::atomic (int64_t) | fetch_and(seq_cst) | 13,48 | 17,535 | 30,08% |
| std::atomic (int64_t) | fetch_or(relaxed) | 10,116 | 14,17 | 40,08% |
| std::atomic (int64_t) | fetch_or(acquire) | 12,802 | 17,514 | 36,81% |
| std::atomic (int64_t) | fetch_or(release) | 13,483 | 18,199 | 34,98% |
| std::atomic (int64_t) | fetch_or(acq_rel) | 13,481 | 17,525 | 30,00% |
| std::atomic (int64_t) | fetch_or(seq_cst) | 13,48 | 17,5 | 29,82% |
| std::atomic (int64_t) | fetch_xor(relaxed) | 10,135 | 14,27 | 40,80% |
| std::atomic (int64_t) | fetch_xor(acquire) | 12,798 | 17,517 | 36,87% |
| std::atomic (int64_t) | fetch_xor(release) | 13,471 | 18,187 | 35,01% |
| std::atomic (int64_t) | fetch_xor(acq_rel) | 13,482 | 17,516 | 29,92% |
| std::atomic (int64_t) | fetch_xor(seq_cst) | 13,62 | 17,516 | 28,60% |
| std::atomic (int64_t) | exchange(relaxed) | 4,2759 | 4,0396 | -5,53% |
| std::atomic (int64_t) | exchange(acquire) | 12,796 | 17,529 | 36,99% |
| std::atomic (int64_t) | exchange(release) | 9,437 | 9,446 | 0,10% |
| std::atomic (int64_t) | exchange(acq_rel) | 14,826 | 18,97 | 27,95% |
| std::atomic (int64_t) | exchange(seq_cst) | 14,821 | 18,872 | 27,33% |
| std::atomic (int64_t) | cmp_xchg_weak(relaxed, relaxed,fail) | 16,841 | 28,313 | 68,12% |
| std::atomic (int64_t) | cmp_xchg_weak(relaxed, relaxed,success) | 14,151 | 27,637 | 95,30% |
| std::atomic (int64_t) | cmp_xchg_weak(acquire, relaxed,fail) | 22,244 | 31,011 | 39,41% |
| std::atomic (int64_t) | cmp_xchg_weak(acquire, relaxed,success) | 19,546 | 29,074 | 48,75% |
| std::atomic (int64_t) | cmp_xchg_weak(acquire, acquire,fail) | 19,545 | 31 | 58,61% |
| std::atomic (int64_t) | cmp_xchg_weak(acquire, acquire,success) | 18,863 | 28,982 | 53,64% |
| std::atomic (int64_t) | cmp_xchg_weak(release, relaxed,fail) | 20,208 | 30,334 | 50,11% |
| std::atomic (int64_t) | cmp_xchg_weak(release, relaxed,success) | 19,544 | 30,014 | 53,57% |
| std::atomic (int64_t) | cmp_xchg_weak(acq_rel, relaxed,fail) | 22,266 | 29,694 | 33,36% |
| std::atomic (int64_t) | cmp_xchg_weak(acq_rel, relaxed,success) | 20,232 | 29,756 | 47,07% |
| std::atomic (int64_t) | cmp_xchg_weak(acq_rel, acquire,fail) | 19,547 | 29,766 | 52,28% |
| std::atomic (int64_t) | cmp_xchg_weak(acq_rel, acquire,success) | 20,216 | 29,784 | 47,33% |
| std::atomic (int64_t) | cmp_xchg_weak(seq_cst, relaxed,fail) | 24,274 | 32,373 | 33,36% |
| std::atomic (int64_t) | cmp_xchg_weak(seq_cst, relaxed,success) | 22,851 | 32,993 | 44,38% |
| std::atomic (int64_t) | cmp_xchg_weak(seq_cst, acquire,fail) | 20,89 | 33,678 | 61,22% |
| std::atomic (int64_t) | cmp_xchg_weak(seq_cst, acquire,success) | 20,88 | 35,128 | 68,24% |
| std::atomic (int64_t) | cmp_xchg_weak(seq_cst, seq_cst,fail) | 22,91 | 32,35 | 41,20% |
| std::atomic (int64_t) | cmp_xchg_weak(seq_cst, seq_cst,success) | 21,559 | 33,07 | 53,39% |
| std::atomic (int64_t) | cmp_xchg_strong(relaxed, relaxed,fail) | 16,856 | 28,309 | 67,95% |
| std::atomic (int64_t) | cmp_xchg_strong(relaxed, relaxed,success) | 14,151 | 27,72 | 95,89% |
| std::atomic (int64_t) | cmp_xchg_strong(acquire, relaxed,fail) | 22,247 | 30,994 | 39,32% |
| std::atomic (int64_t) | cmp_xchg_strong(acquire, relaxed,success) | 19,531 | 28,984 | 48,40% |
| std::atomic (int64_t) | cmp_xchg_strong(acquire, acquire,fail) | 20,884 | 30,979 | 48,34% |
| std::atomic (int64_t) | cmp_xchg_strong(acquire, acquire,success) | 19,552 | 29,102 | 48,84% |
| std::atomic (int64_t) | cmp_xchg_strong(release, relaxed,fail) | 20,21 | 30,34 | 50,12% |
| std::atomic (int64_t) | cmp_xchg_strong(release, relaxed,success) | 19,537 | 29,982 | 53,46% |
| std::atomic (int64_t) | cmp_xchg_strong(acq_rel, relaxed,fail) | 22,227 | 29,674 | 33,50% |
| std::atomic (int64_t) | cmp_xchg_strong(acq_rel, relaxed,success) | 20,196 | 29,732 | 47,22% |
| std::atomic (int64_t) | cmp_xchg_strong(acq_rel, acquire,fail) | 20,86 | 29,6 | 41,90% |
| std::atomic (int64_t) | cmp_xchg_strong(acq_rel, acquire,success) | 20,205 | 29,645 | 46,72% |
| std::atomic (int64_t) | cmp_xchg_strong(seq_cst, relaxed,fail) | 24,917 | 32,326 | 29,73% |
| std::atomic (int64_t) | cmp_xchg_strong(seq_cst, relaxed,success) | 22,35 | 33,308 | 49,03% |
| std::atomic (int64_t) | cmp_xchg_strong(seq_cst, acquire,fail) | 20,898 | 33,711 | 61,31% |
| std::atomic (int64_t) | cmp_xchg_strong(seq_cst, acquire,success) | 20,219 | 35,049 | 73,35% |
| std::atomic (int64_t) | cmp_xchg_strong(seq_cst, seq_cst,fail) | 22,916 | 32,376 | 41,28% |
| std::atomic (int64_t) | cmp_xchg_strong(seq_cst, seq_cst,success) | 20,902 | 33,571 | 60,61% |
The absolute numbers are significantly slower than on the S22 (more than 2x), which is not surprising.
Comparing the outline version to a “normal” one (inline LL/SC atomics), the following conclusions can be made:
- Outline atomics are always slower than “normal” builds
- The absolute overhead of outline atomics lies within the range of 5 to 10 ns (!!) which is much higher than on LSE-capable devices. This applies both to STL’s and baselib’s atomics.
- The relative overhead is quite high in this case, higher than the 20% threshold suggested at the beginning, and in some cases even more than 100%.
Our friends at Arm did their own measurements and confirmed that the overhead of outline atomics on Cortex-A53 is higher than that on LSE-capable devices, likely caused by less efficient branch prediction.
Conclusion
Applying outline atomics is really very very easy – it’s just a compiler flag. The feature implementation is very appealing because of the backward compatibility it provides.
Results on modern, LSE-capable devices are positive. The overhead related to the function call with outline atomics is much less than the benefits brought by new atomic instructions.
However, the performance results on older devices are quite disappointing. The overhead is significantly higher than the 20% threshold expected at the beginning.
One of Unity’s core values is Users First, and unfortunately, we cannot sacrifice a large portion of our users (Cortex A53 is still very, very popular) for the benefit of another group. We can wait until the share of non-LSE-capable devices is negligible, or try some other tactics (our own dispatch at a higher level – for example, in lockless collections, job system?).
As a result, we are not adopting outline atomics at the moment. This conclusion is to be reassessed in few years.
Your mileage with the feature may vary depending on your target CPUs. If the share of old in-order cores is low for you, then adopting outline atomics may be a valid trade-off.
Function Multi-Versioning
Since the approach when the compiler automatically generates the necessary runtime dispatch for you is nice and elegant, and it helps optimize your code for latest Arm architectures, Arm started developing a generic version of this feature, called Function Multi-versioning, and it’s being added to Clang and GCC. Here’s the description: https://github.com/ARM-software/acle/blob/main/main/acle.md#function-multi-versioning – check it out if you want to target newer Arm architecture extensions while maintaining backward compatibility!